







UAV systems / Mapping & survey

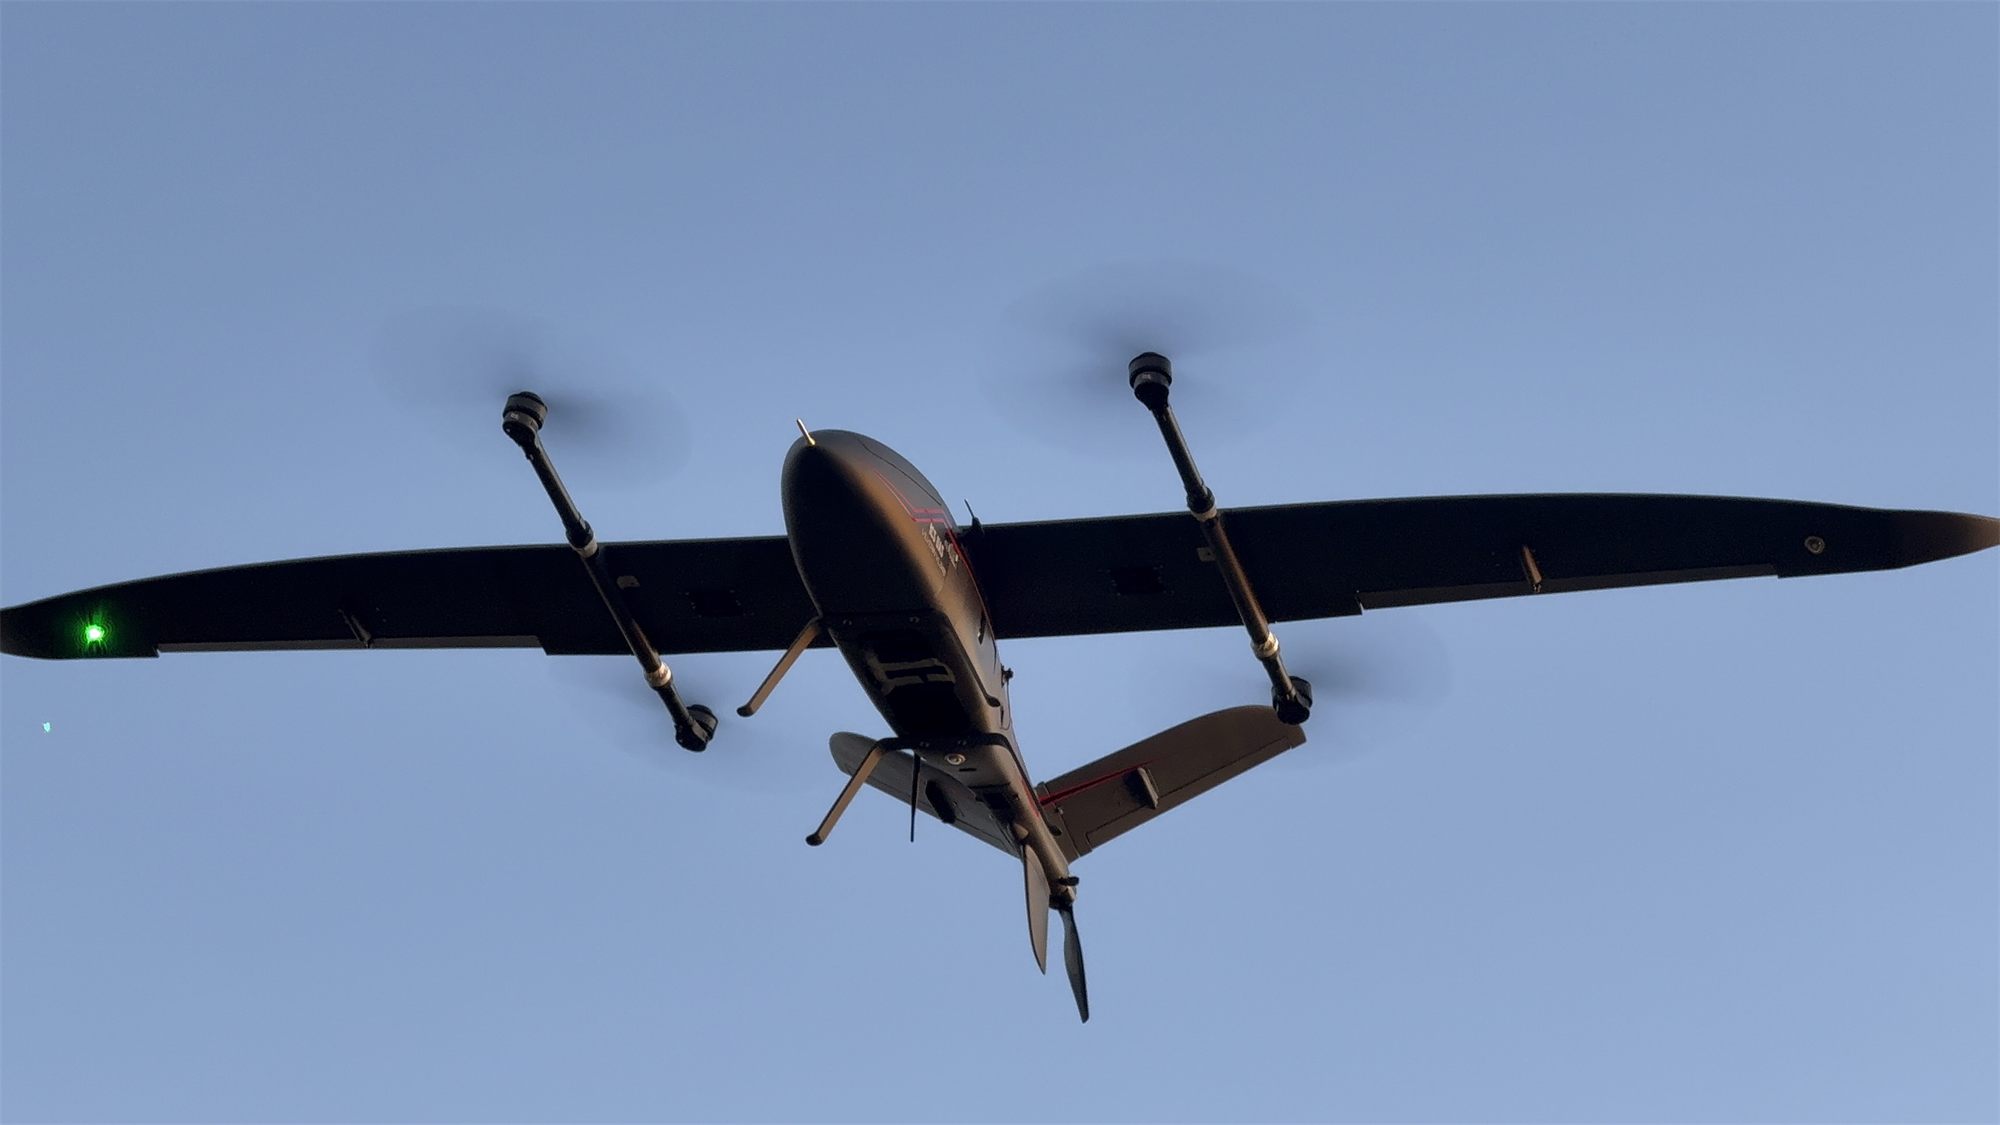
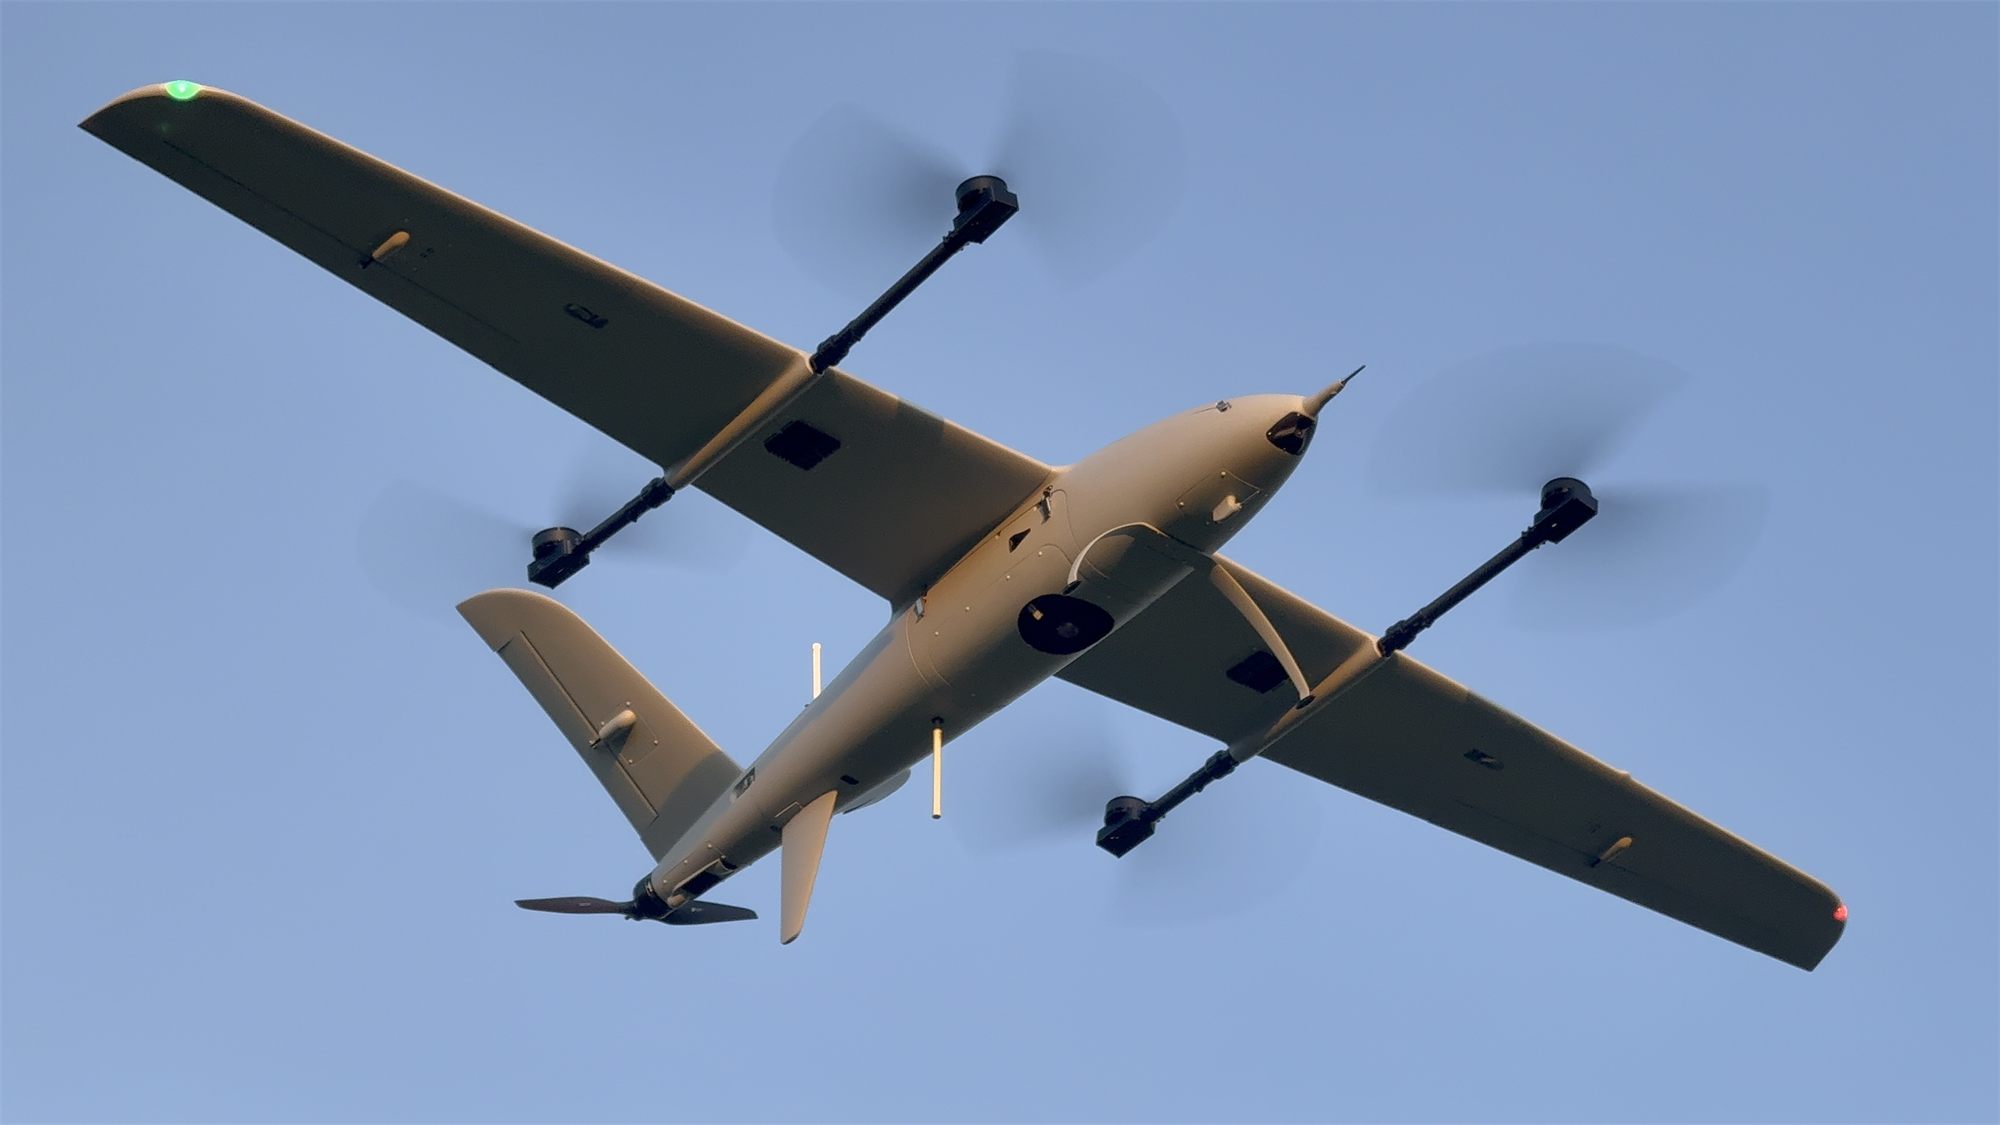
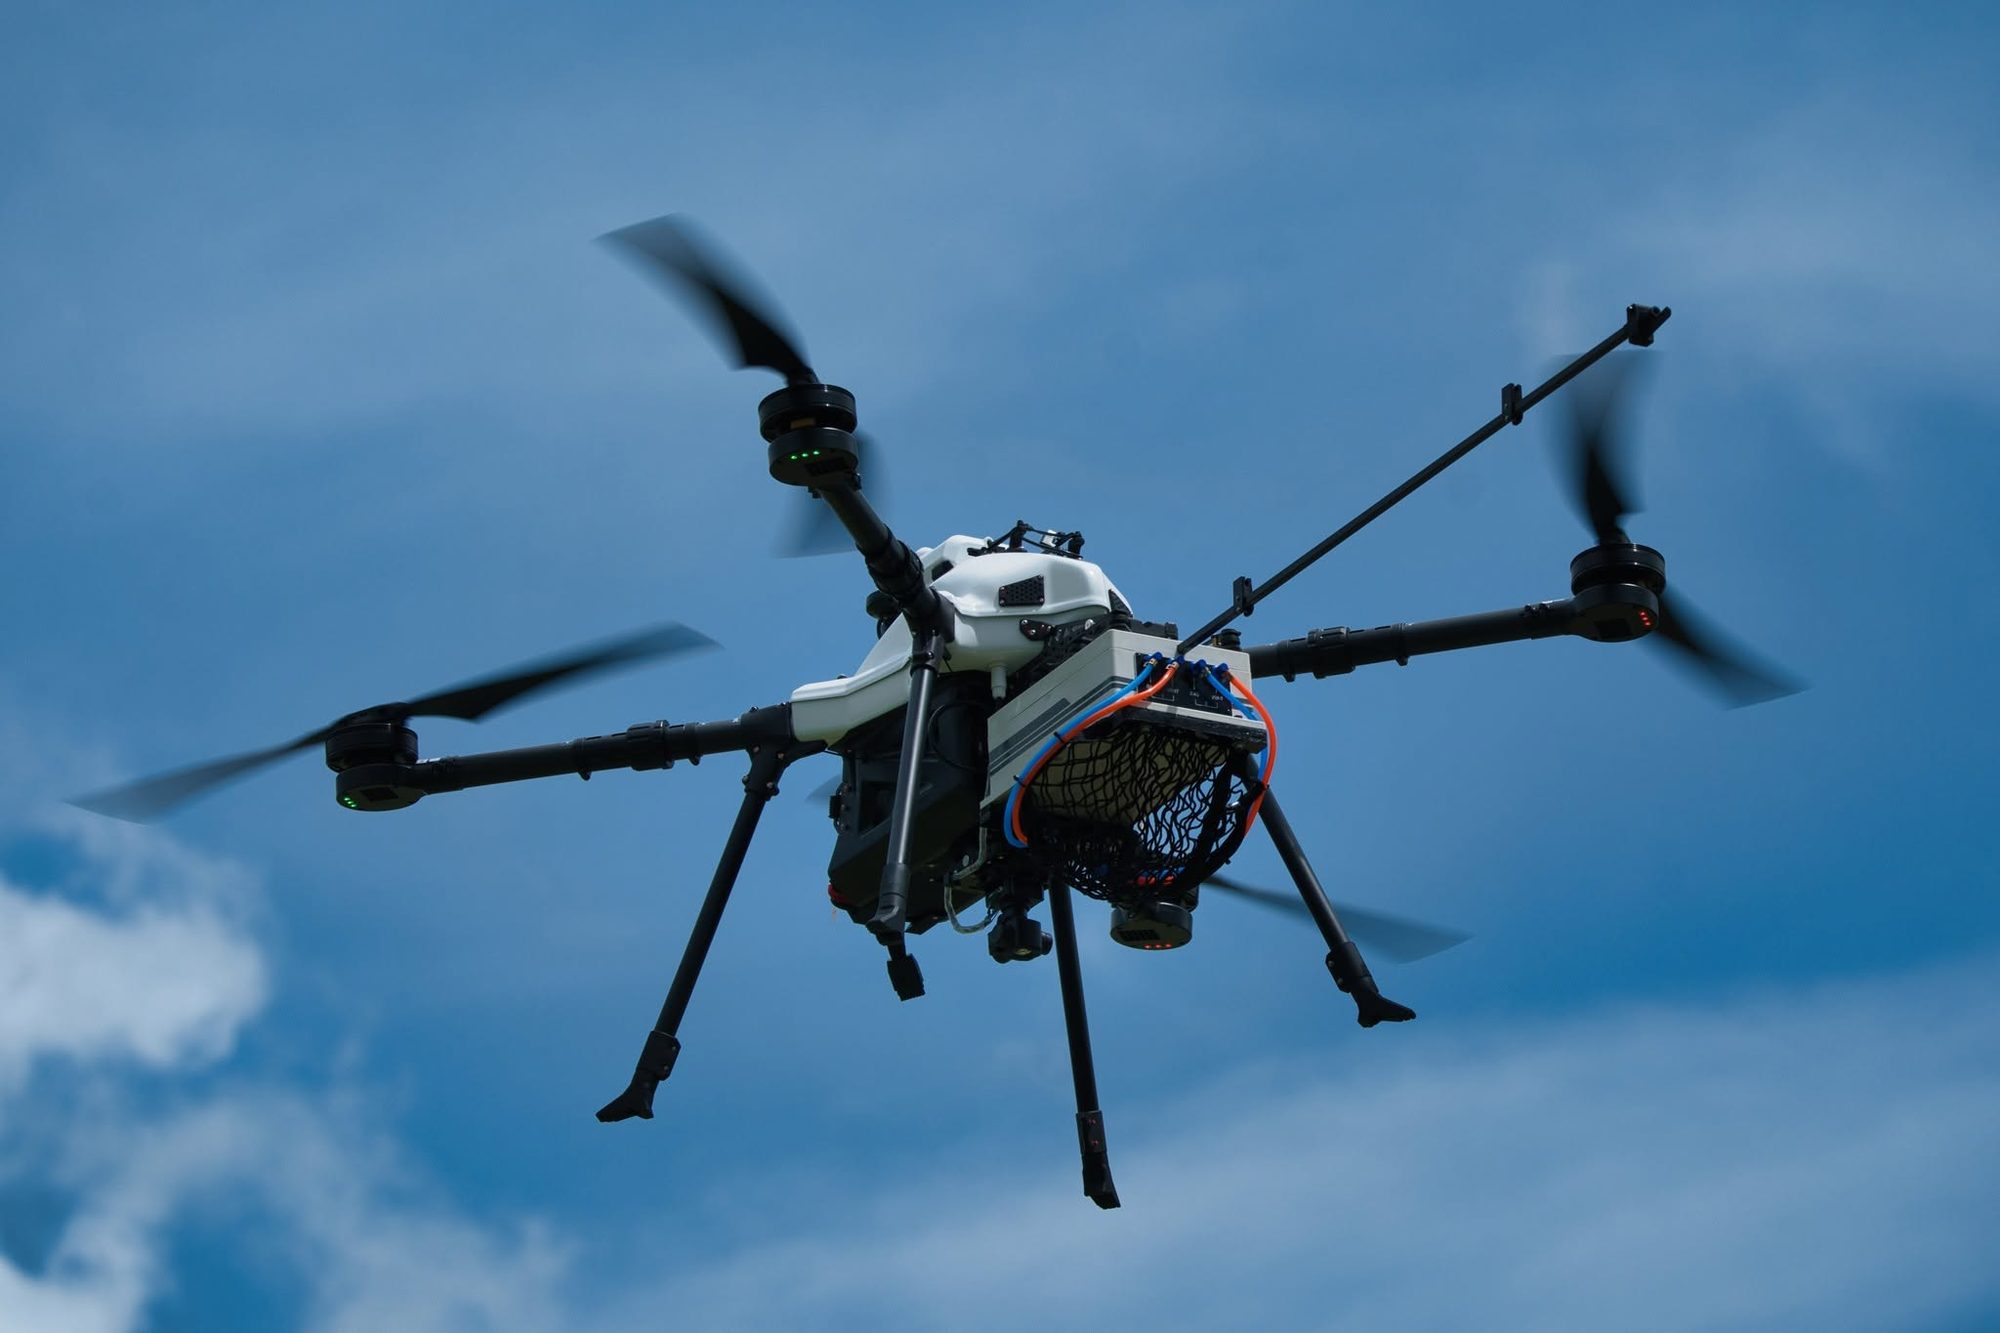
Map large areas, up to 5× more per day than a multirotor*

About 3× more area close to the launch point, and more than 5× once the site is about 6 km or more away.

* Compared with an enterprise-grade multirotor, which flies longer and faster than a standard drone. A standard drone takes longer still.

Request a flight demo

Area covered in a single flight

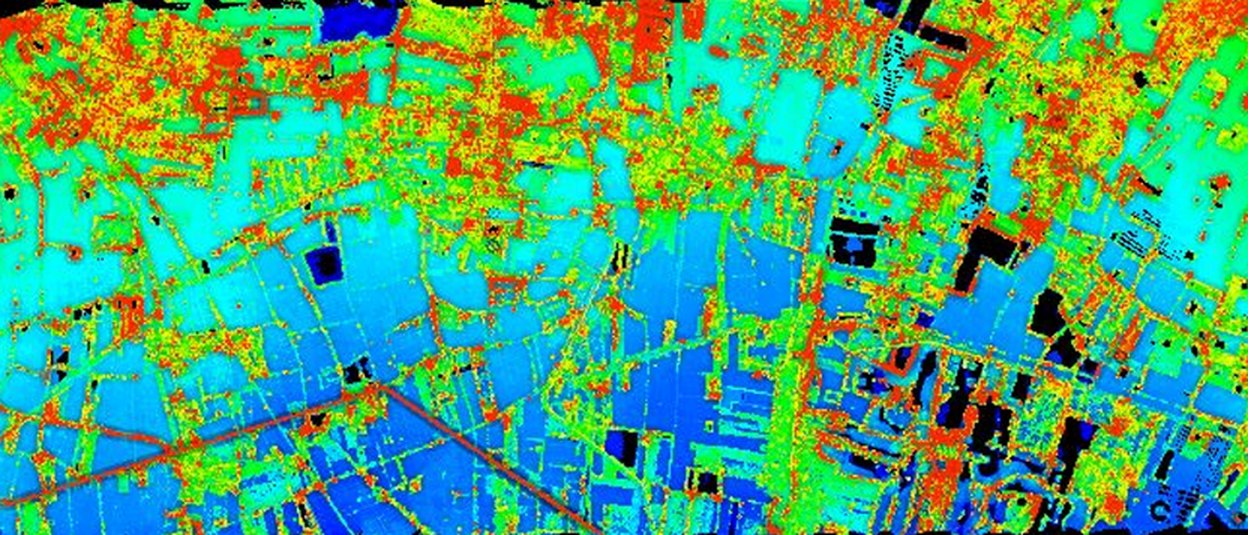
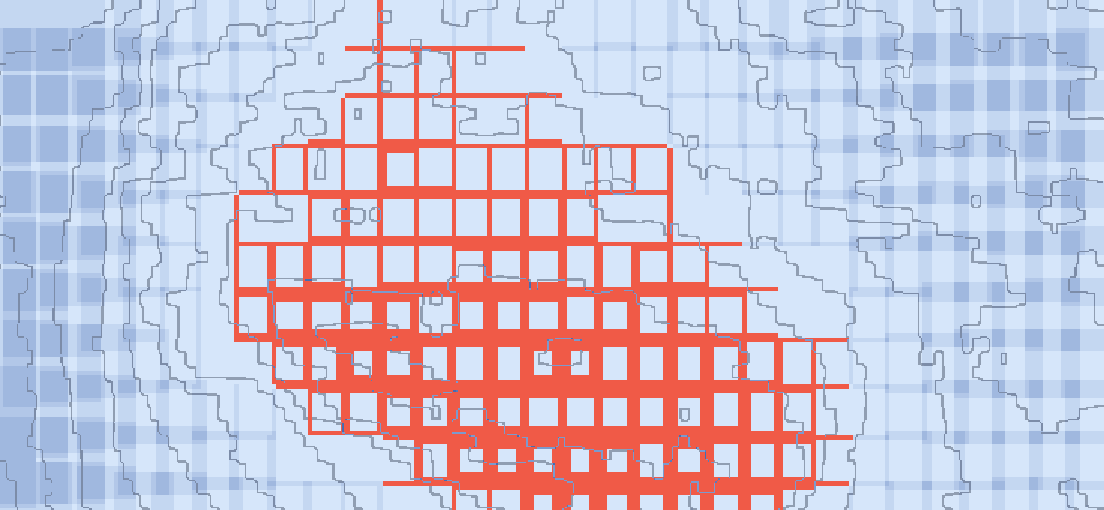
The same map, cut to the area each aircraft covers in one flight.

Enterprise multirotor*1.5 km² per flight
ICS eVTOL6.5 km² per flight
Per flight
6.5 km²
90 min at 23 m/s
Per day
32.5 km²
5 flights a day
Versus a multirotor*
3×
area per day (10.5 km²)

Image: digital surface model processed from RGB photos of a real ICS job, cropped in proportion to the area per flight, at the same 2.82 cm GSD (Sony ILX-LR1 40 mm at 300 m). · * Compared with an enterprise-grade multirotor, which flies longer and faster than a standard drone. A standard drone takes longer still.

Why eVTOL: coverage per day

Figures from ICS operation and mapping-for-service work. Change flight height and overlap to see how GSD and area per day change for each aircraft.

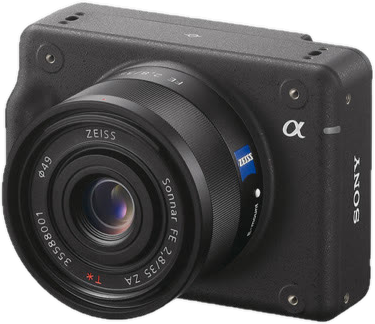
Standard cameraSony ILX-LR1 · 61 MP · 40 mm
GSD
2.82cm/px
Line spacing
54m
Photo every (eVTOL 23 m/s)
2.3s
Area surveyed per day (km²)
  1. Avix GN22024.0 km²
  2. Vertix VL26032.5 km²
  3. Vilverin VL34042.5 km²
  4. Xtrix VL39052.5 km²
  5. Voxel MX15.4 km²
  6. Enterprise multirotor* (reference)10.5 km²

For comparing settings only. Real flights vary with weather and battery condition. Flights per day count only the hours with light suitable for mapping and already include time for imagery and GNSS data checks.

100 km²: Xtrix VL390 takes about 2 days · a multirotor about 10 days

View as table
Aircraftkm² / flightFlights/daykm² / dayDays
Avix GN2204.0624.0~4
Vertix VL2606.5532.5~3
Vilverin VL3408.5542.5~2
Xtrix VL39010.5552.5~2
Voxel MX2.2715.4~6
Enterprise multirotor* (reference)1.5710.5~10

How the figures are worked out

Standard settings
300 m height · 70/80% overlap · 25% battery reserve
Avix GN220
4 km² × 6 flights/day
Vertix VL260
6.5 km² × 5 flights/day
Vilverin VL340
8.5 km² × 5 flights/day
Xtrix VL390
10.5 km² × 5 flights/day
Voxel MX
2.2 km² × 7 flights/day
Enterprise multirotor* (reference)
1.5 km² × 7 flights/day

Figures from ICS mapping-for-service flights · changing height or side overlap scales area per flight with line spacing · days rounded to whole days · from 400 m up, flight time is cut by 5% (thinner air, longer climb) · an estimate: real results depend on site shape, wind, terrain and launch-site moves.

A 100 km² survey

Done in 3 days, not 10

  • Fewer launch-site moves (each takes 30-60 minutes)
  • Fewer battery swaps and faster pre-flight checks
  • About 2× higher cruise speed (23 vs 12 m/s), continuous coverage
  • Vertix VL260~3 days
  • Enterprise multirotor*~10 days

What you get back from a flight

  1. 01

    Fly

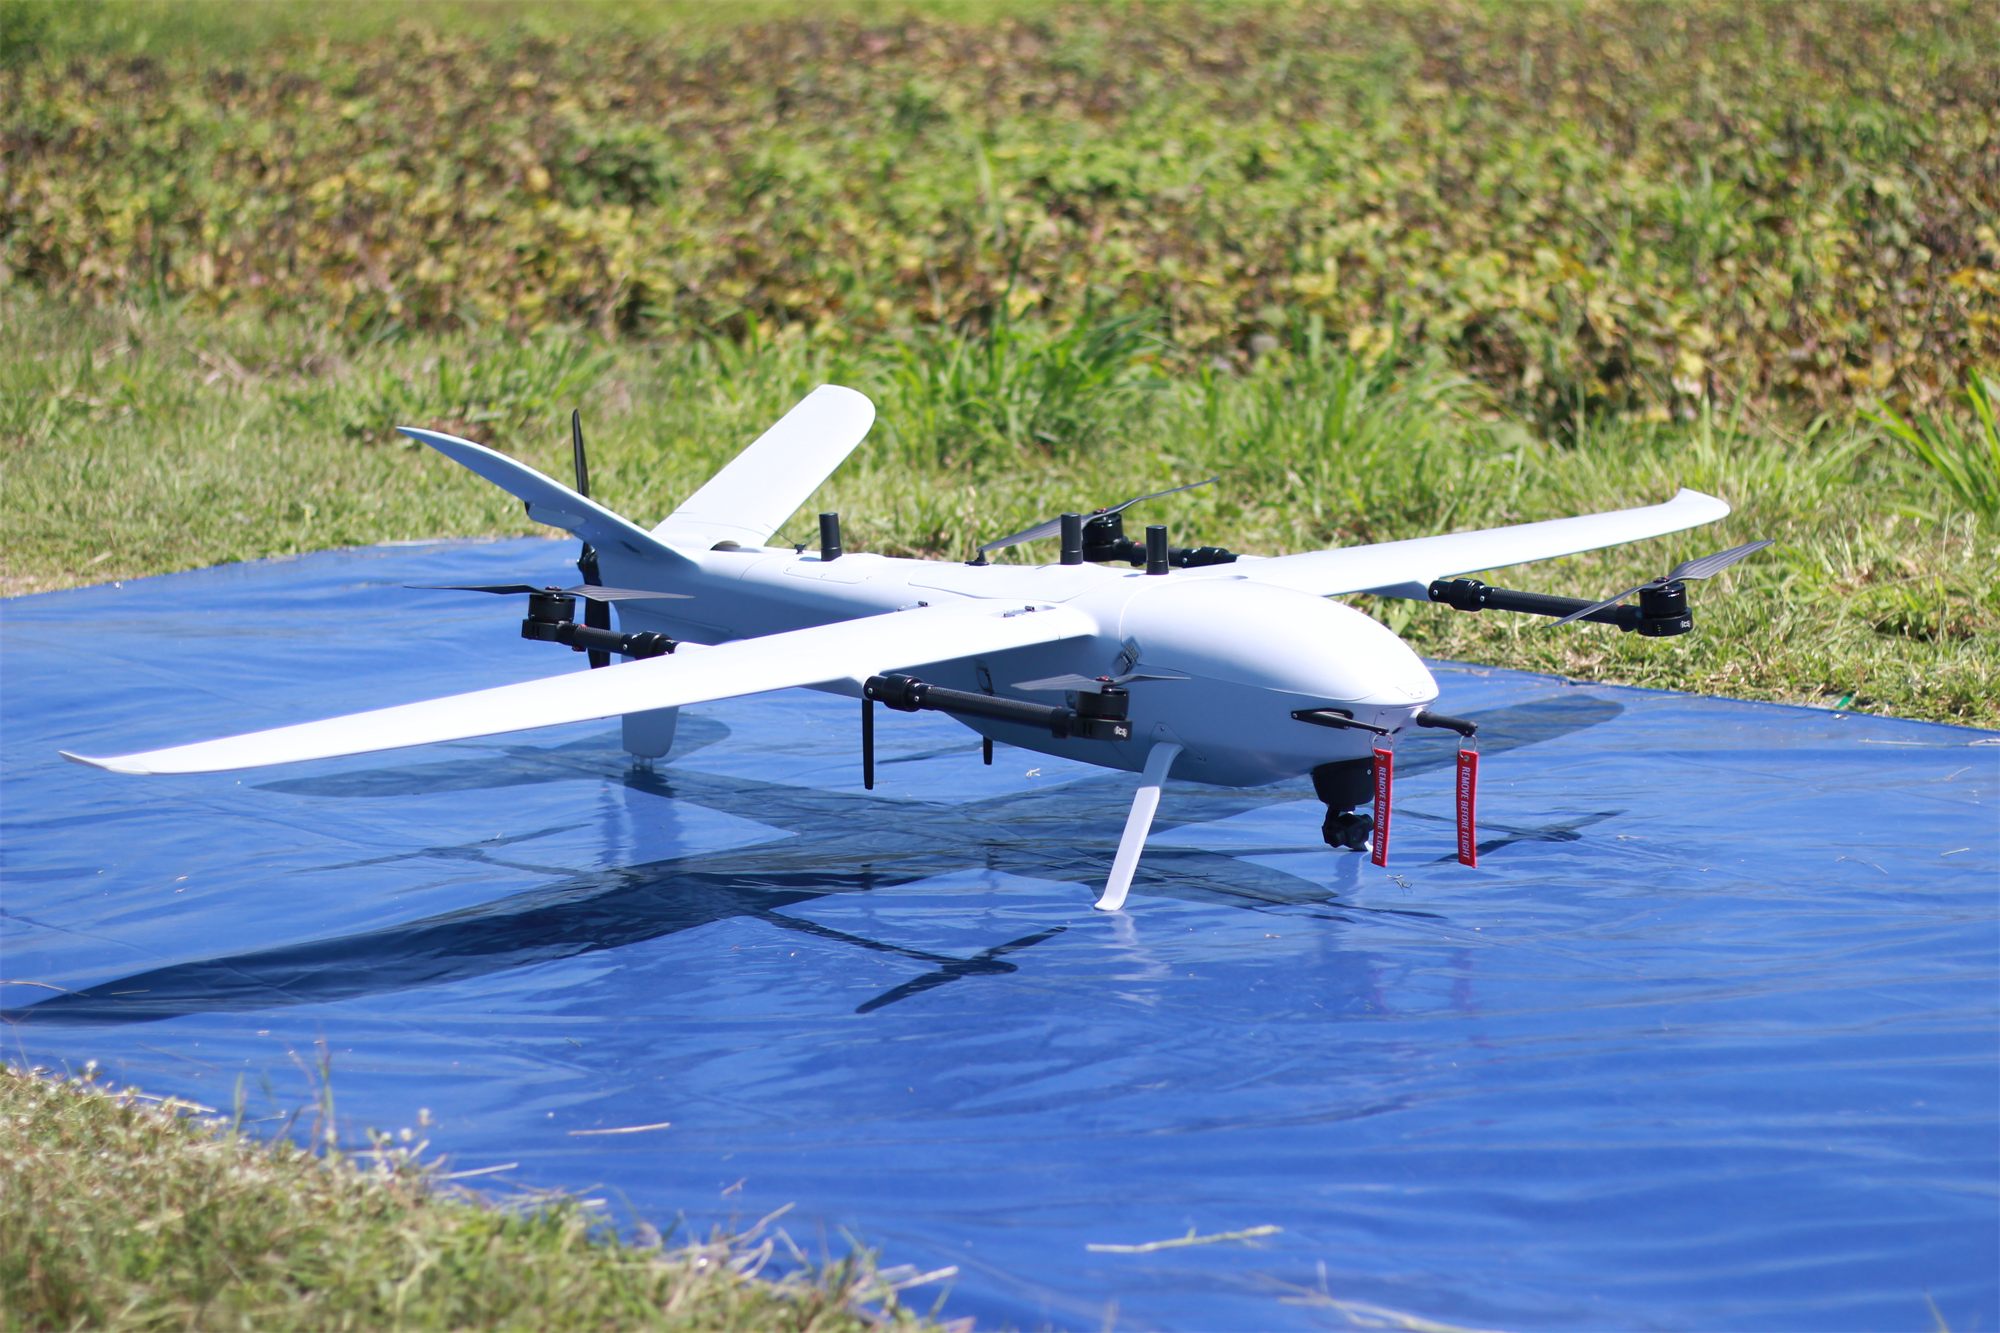
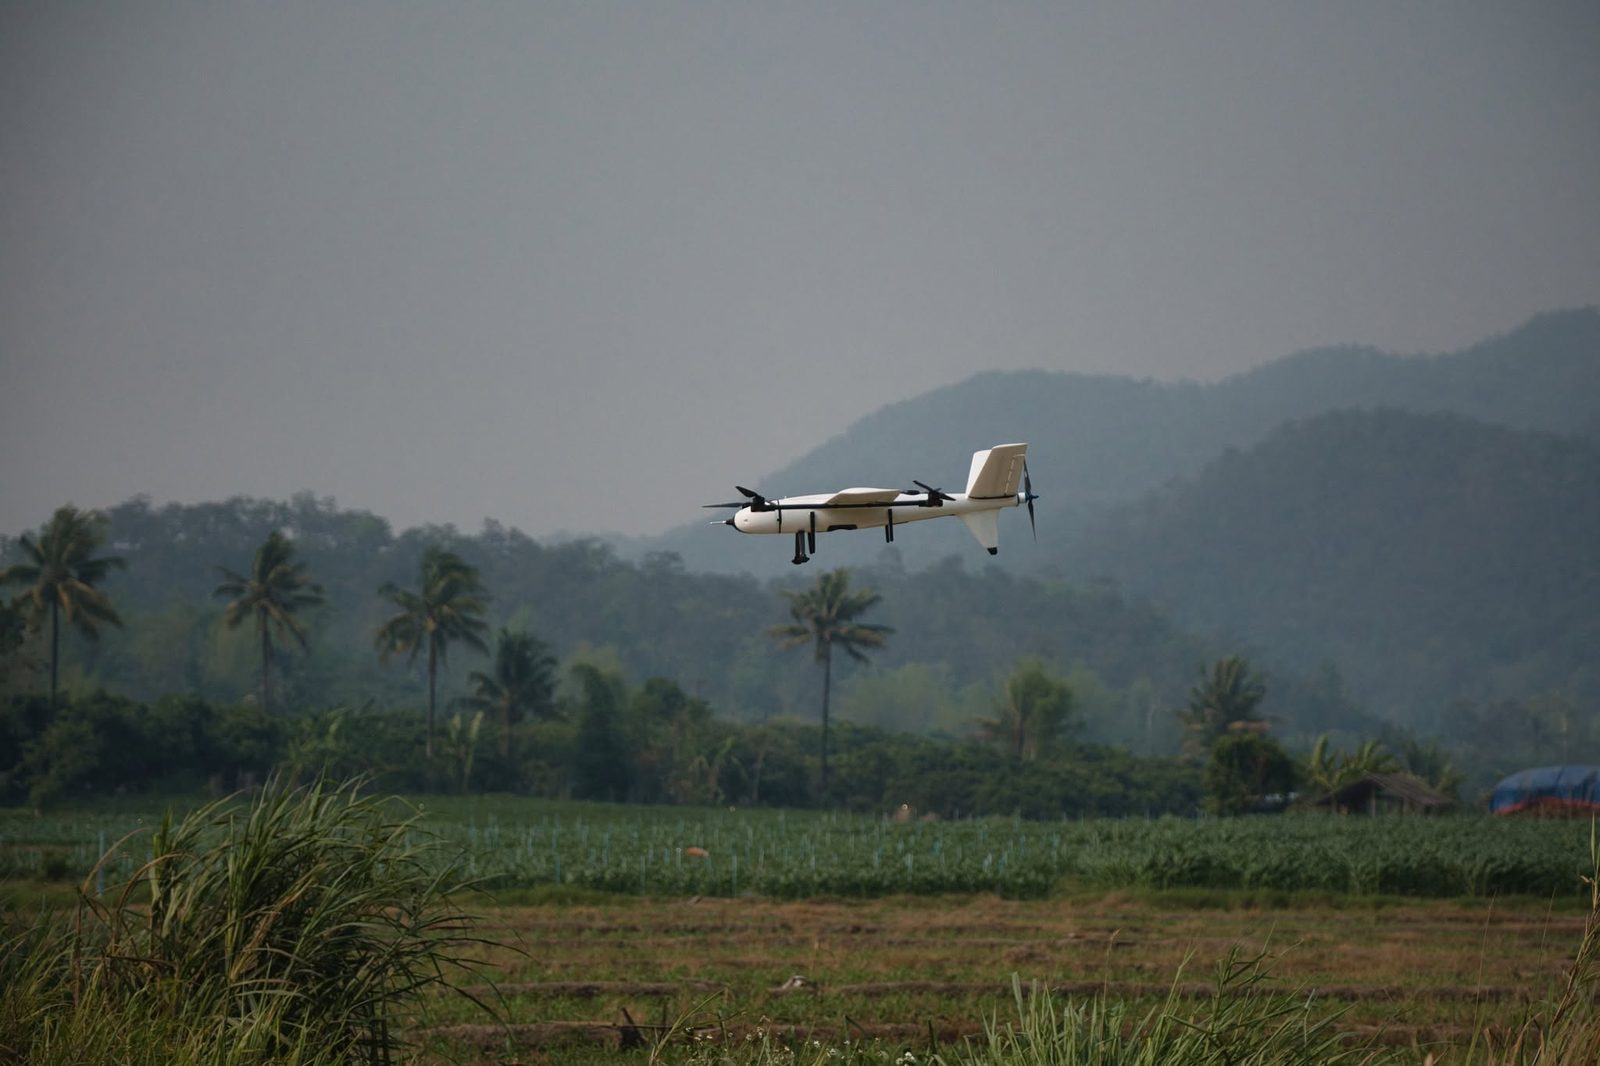
    VL260 flies 5 sorties a day, about 6.5 km² each, taking off vertically from a small clearing.

  2. 02

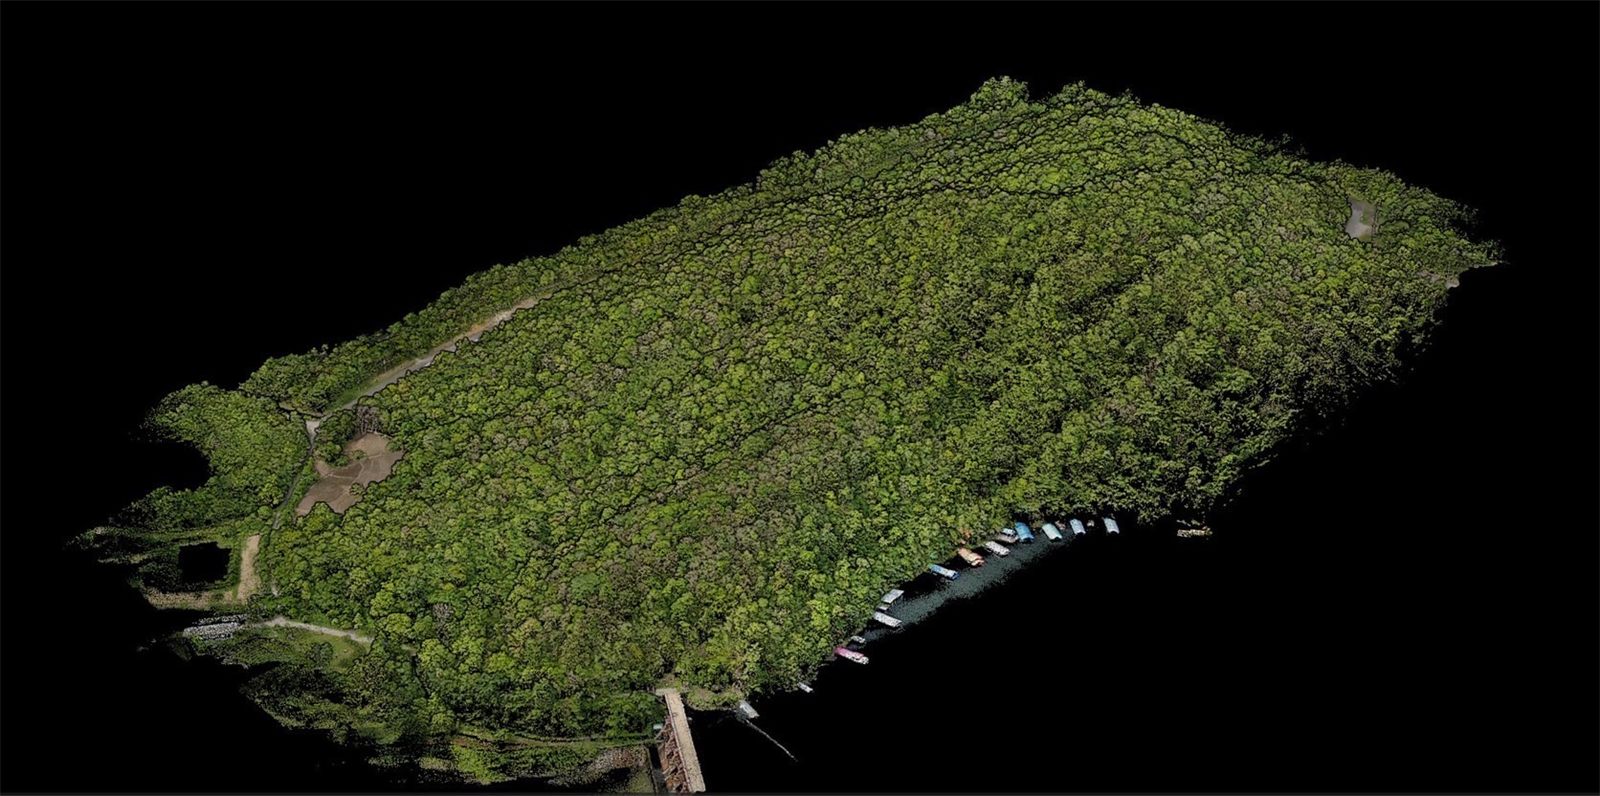
    3D point cloud

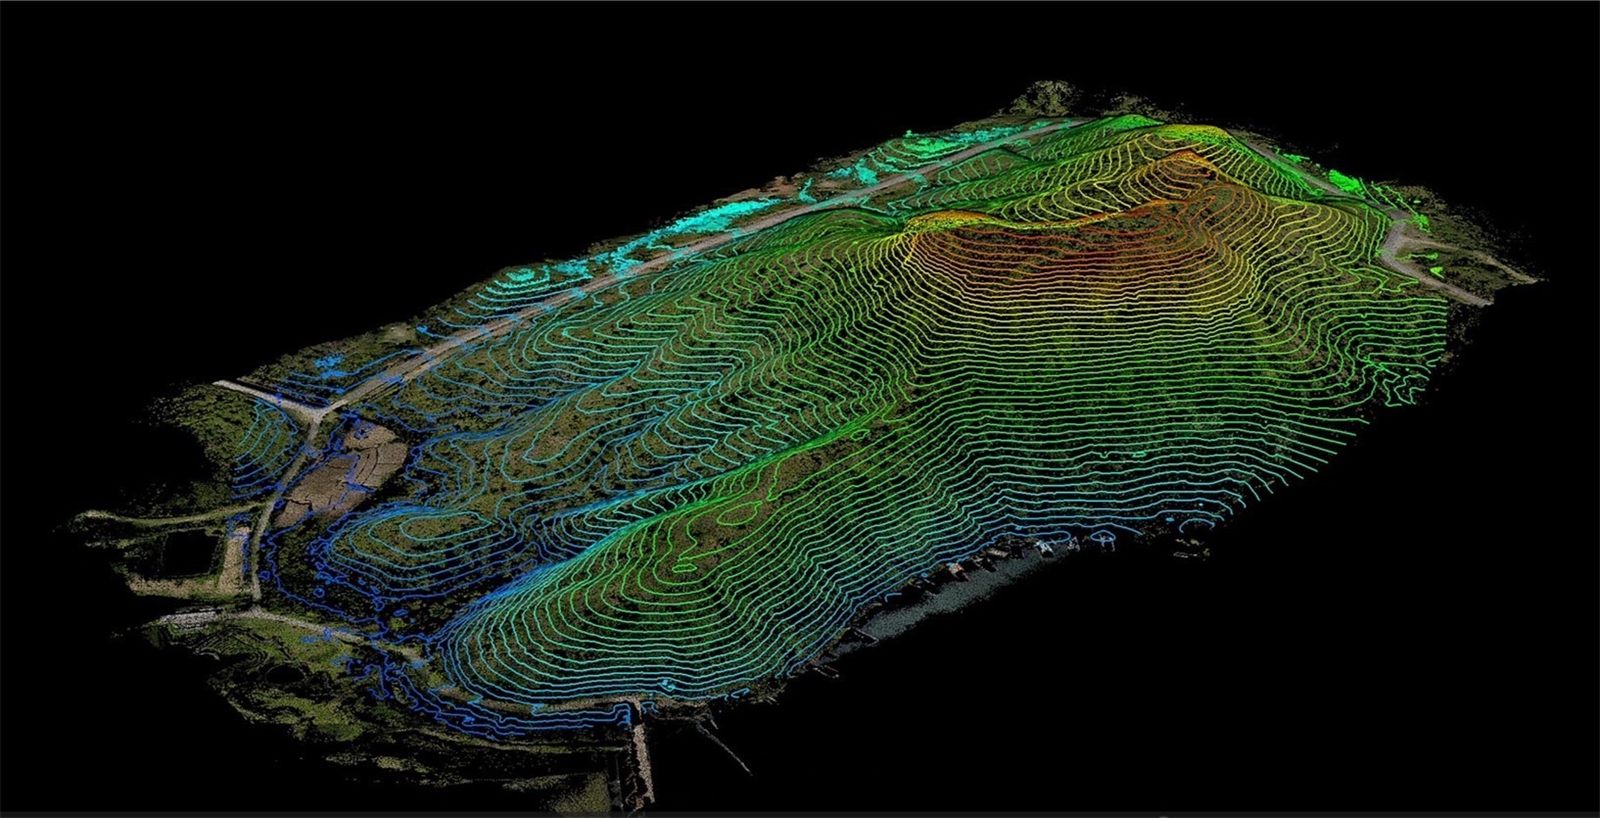
    Every point on the site becomes a 3D coordinate: trees, roads and the waterline.

  3. 03

    Ground under the canopy

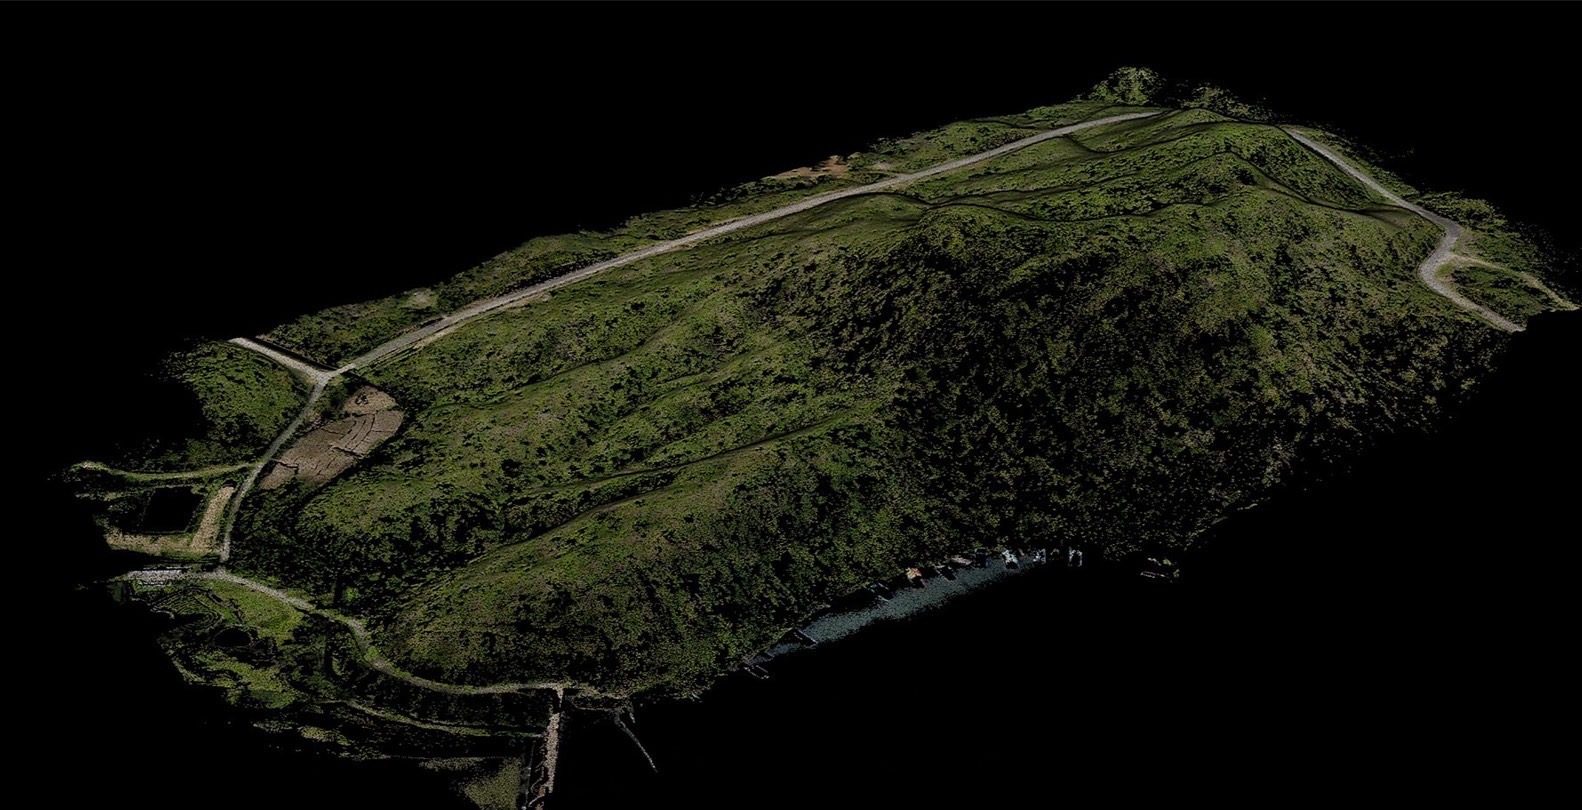
    Strip the trees to the bare ground, showing tracks and gullies a photo cannot see.

  4. 04

    Contours

    Ready for design, cut-and-fill volumes and drainage layout.

* Compared with an enterprise-grade multirotor, which flies longer and faster than a standard drone. A standard drone takes longer still.
Days: Sony ILX-LR1 40 mm, 300 m, 70/80% overlap, 25% battery reserve · Images 2–4: real ICS LiDAR output

Camera option: 102 MP medium format flies higher

Same aircraft, same flight time; only the camera changes. The R10PS-50 gives finer detail at the same height, or the same GSD from higher up. Change flight height and overlap to see the effect on GSD and area per day.

Camera (option)Riebo R10PS-50 · 102 MP medium format · 50 mm
GSD
2.26cm/px
Line spacing
59m
Photo every (eVTOL 23 m/s)
2.3s
Area surveyed per day (km²)
  1. Avix GN22026.5 km²
  2. Vertix VL26035.9 km²
  3. Vilverin VL34046.9 km²
  4. Xtrix VL39058.0 km²
  5. Voxel MX17.0 km²
  6. Enterprise multirotor* (reference)11.6 km²

For comparing settings only. Real flights vary with weather and battery condition. Flights per day count only the hours with light suitable for mapping and already include time for imagery and GNSS data checks.

100 km²: Xtrix VL390 takes about 2 days · a multirotor about 9 days

View as table
Aircraftkm² / flightFlights/daykm² / dayDays
Avix GN2204.4626.5~4
Vertix VL2607.2535.9~3
Vilverin VL3409.4546.9~2
Xtrix VL39011.6558.0~2
Voxel MX2.4717.0~6
Enterprise multirotor* (reference)1.7711.6~9

How the figures are worked out

Standard for the aircraft figures (Sony ILX-LR1)
300 m height · 70/80% overlap · 25% battery reserve
Avix GN220
4 km² × 6 flights/day
Vertix VL260
6.5 km² × 5 flights/day
Vilverin VL340
8.5 km² × 5 flights/day
Xtrix VL390
10.5 km² × 5 flights/day
Voxel MX
2.2 km² × 7 flights/day
Enterprise multirotor* (reference)
1.5 km² × 7 flights/day

Flight time and flights per day use the same model as the Sony planner, since the camera weight differs little; only the ground each photo covers changes (GSD, line spacing, photo interval) · camera figures from the maker's data sheet · days rounded to whole days · from 400 m up, flight time is cut by 5% (thinner air, longer climb) · an estimate: real results depend on site shape, wind, terrain and launch-site moves.

Real jobs are bigger and farther

Close in, eVTOL maps about 3× more area per day. Real jobs are often away from any usable launch point, or far larger, and that is where the gap opens up.

Site 10 km away: 8× more per day

Every flight flies out and back before it can map. eVTOL cruises faster and flies longer, so it keeps most of its time for mapping. A multirotor cannot work a site beyond ~14 km.

Area mapped per day when the site is away from the launch point
  • ICS eVTOL (VL260)
  • Enterprise multirotor*
0102030km²/dayMultirotorout of reach8× more05101520Distance from launch point to survey area (km)eVTOLMultirotor

Bigger area, more days saved

The ratio stays about 3×, but the days saved grow with the job. Not yet counted: the launch-site moves a multirotor needs more often (30–60 min each).

Flying days by survey size (launching at the area's edge)
  • ICS eVTOL (VL260)
  • Enterprise multirotor*
01020304050days13 days saved32 days saved0100200300400500Survey area (km²)eVTOLMultirotor

* Compared with an enterprise-grade multirotor, which flies longer and faster than a standard drone. A standard drone takes longer still.
Figures are for comparison only. Real flights vary with weather and battery condition. Flights per day count only the hours with light suitable for mapping and already include time for imagery and GNSS data checks.

Numbers and assumptions
Distance to siteeVTOL km²/dayMultirotor km²/day
0 km32.510.5
5 km29.96.9
10 km27.33.2
15 km24.6out of reach
AreaeVTOL daysMultirotor daysSaved (days)
100 km²~3~10~6
300 km²~9~29~19
500 km²~15~48~32

Assumptions: ICS eVTOL fixed-wing: 90 min, 23 m/s, 6.5 km²/flight, 5 flights/day · Enterprise multirotor: 40 min, 12 m/s, 1.5 km²/flight, 7 flights/day. Sony ILX-LR1 40 mm at 300 m, 70/80% overlap, 25% battery reserve. Transit is flown at cruise speed; area per flight shrinks with the time left. A comparison model, not a flight result.

Field track record

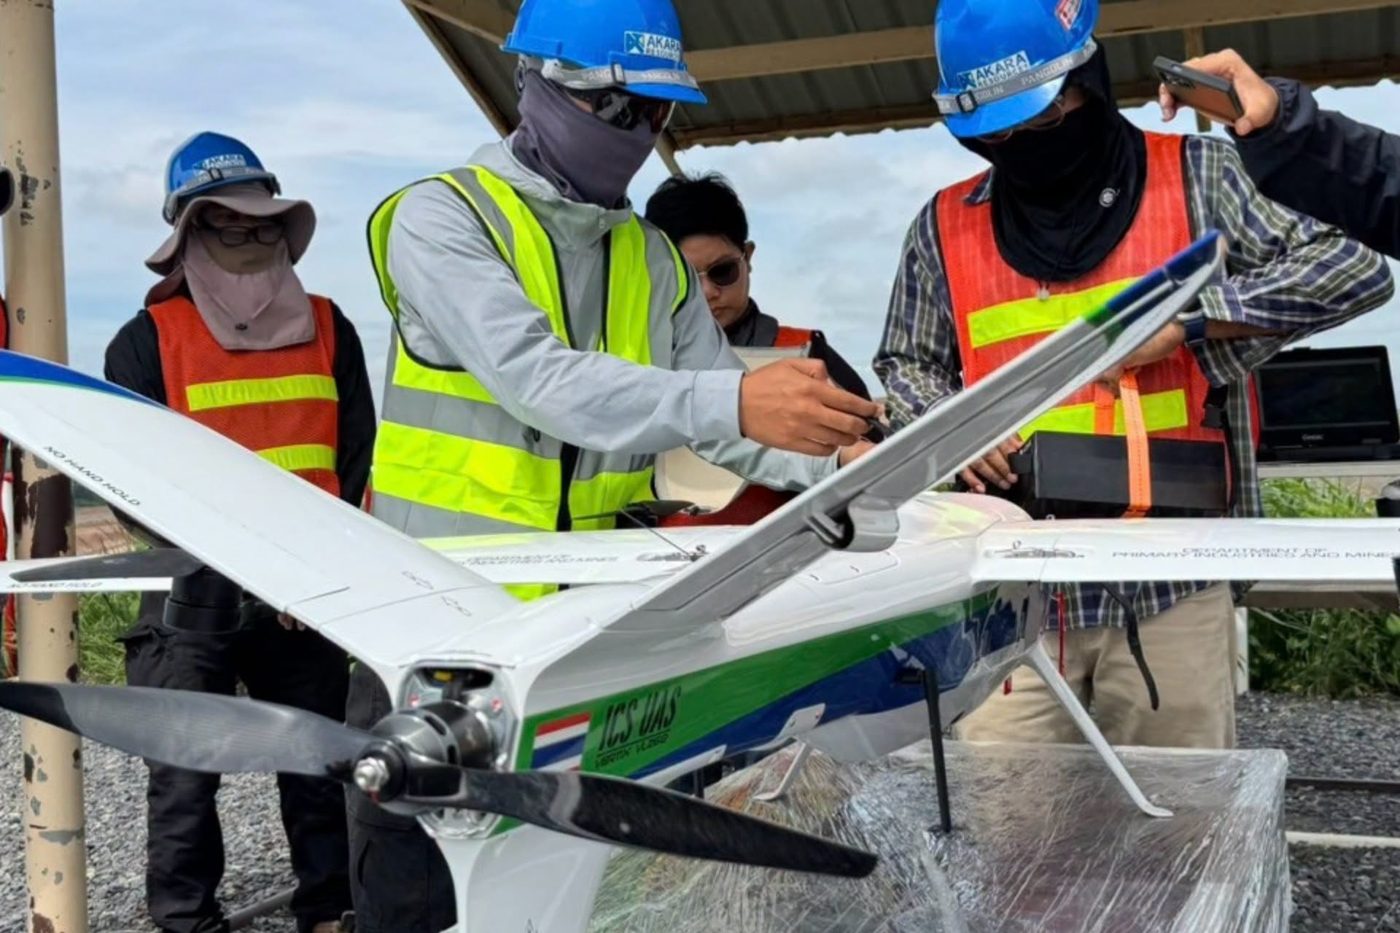
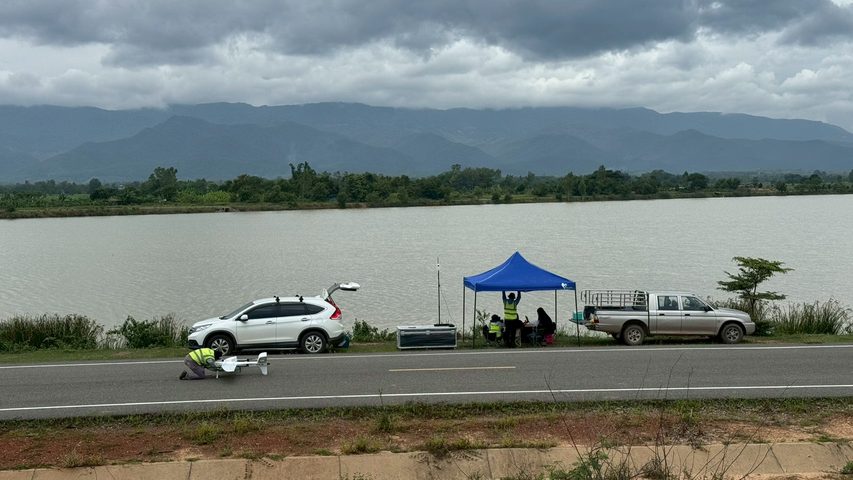
Survey flights and on-site training on live jobs with government agencies and state enterprises across Thailand.

  • Vertix VL260 handover with on-site training

    On-site training, live job

    Vertix VL260 handover with on-site training

    System set-up, operator training and support through the first live missions

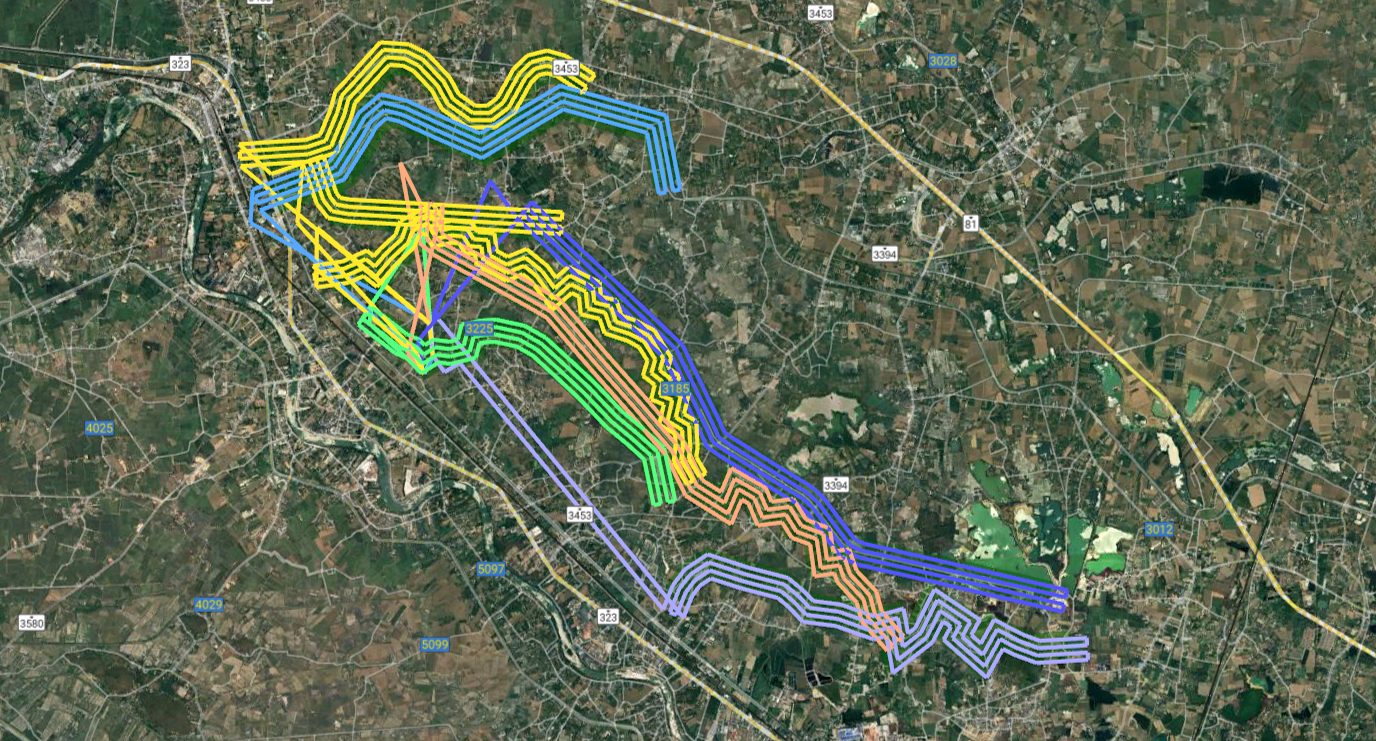
  • 450 km of irrigation canals surveyed2,000 km

    Survey · Ratchaburi–Nakhon Pathom

    450 km of irrigation canals surveyed

    2,000 km flown along the canal network, coordinated with Kamphaeng Saen control tower

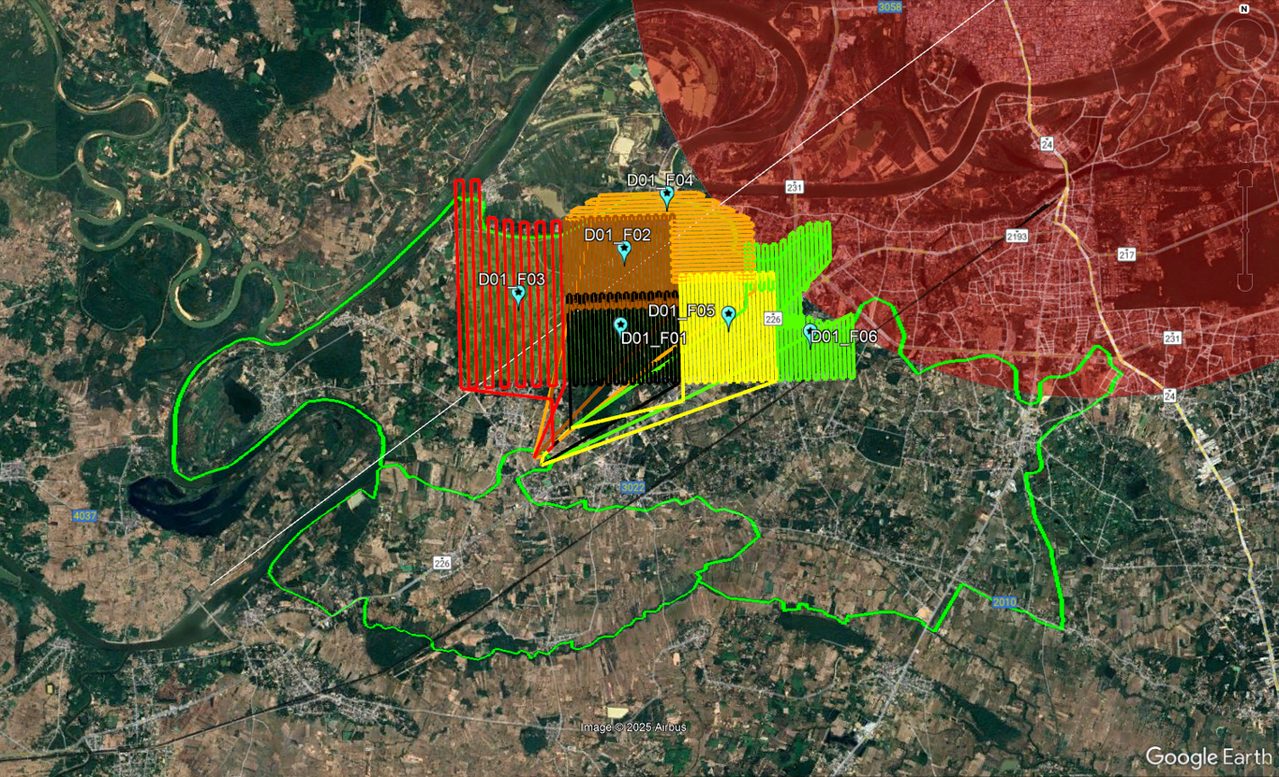
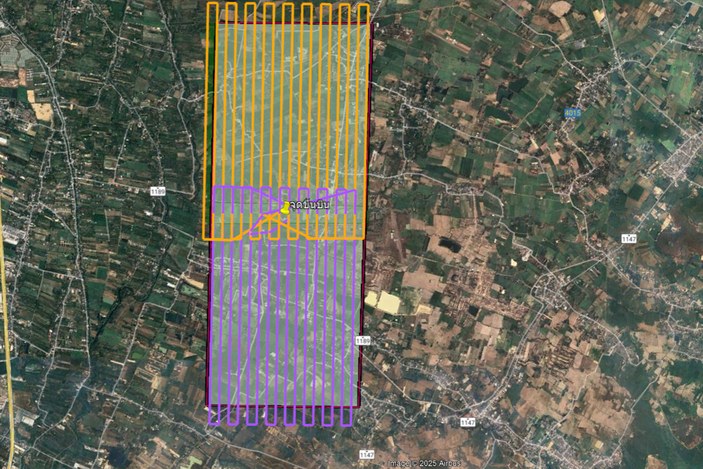
  • 120 km² irrigation area beside an airport120 km²

    Survey · Ubon Ratchathani

    120 km² irrigation area beside an airport

    Flown in blocks inside approved time windows, coordinated with Ubon Ratchathani tower under a NOTAM

  • LiDAR for an airport feasibility studyLiDAR

    Survey · Chiang Mai

    LiDAR for an airport feasibility study

    LiDAR survey of the Chiang Mai Lanna site to assess whether an airport can be built

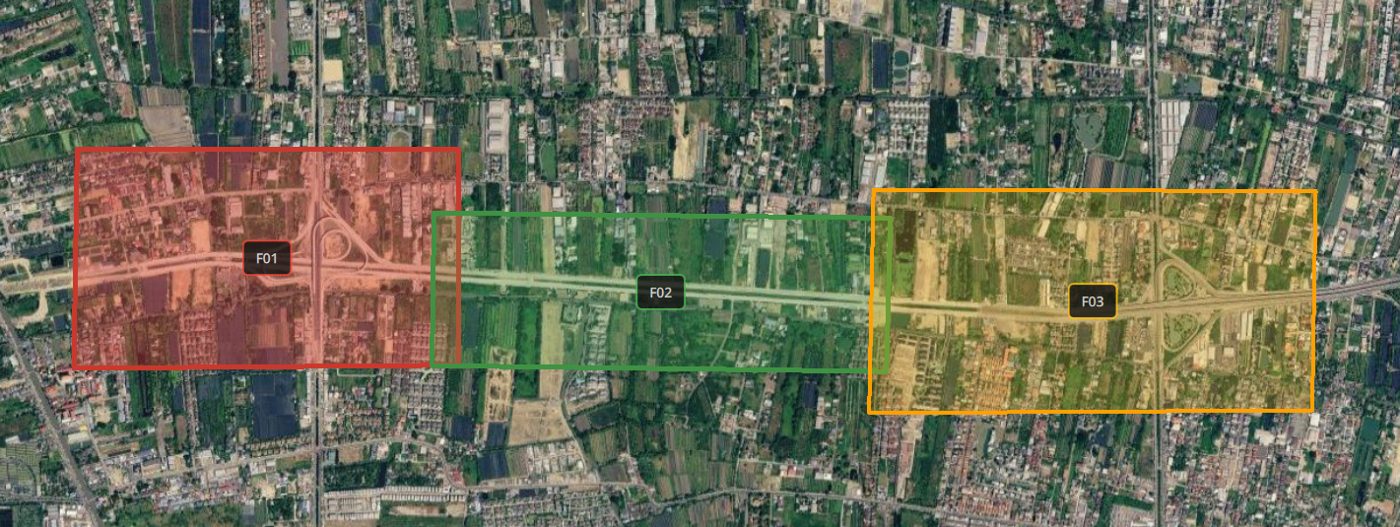
  • Road inspection

    On-site training, live job · Bangkok

    Road inspection

    Connecting road between Phutthamonthon Sai 2 and Thawi Watthana, flown in sections

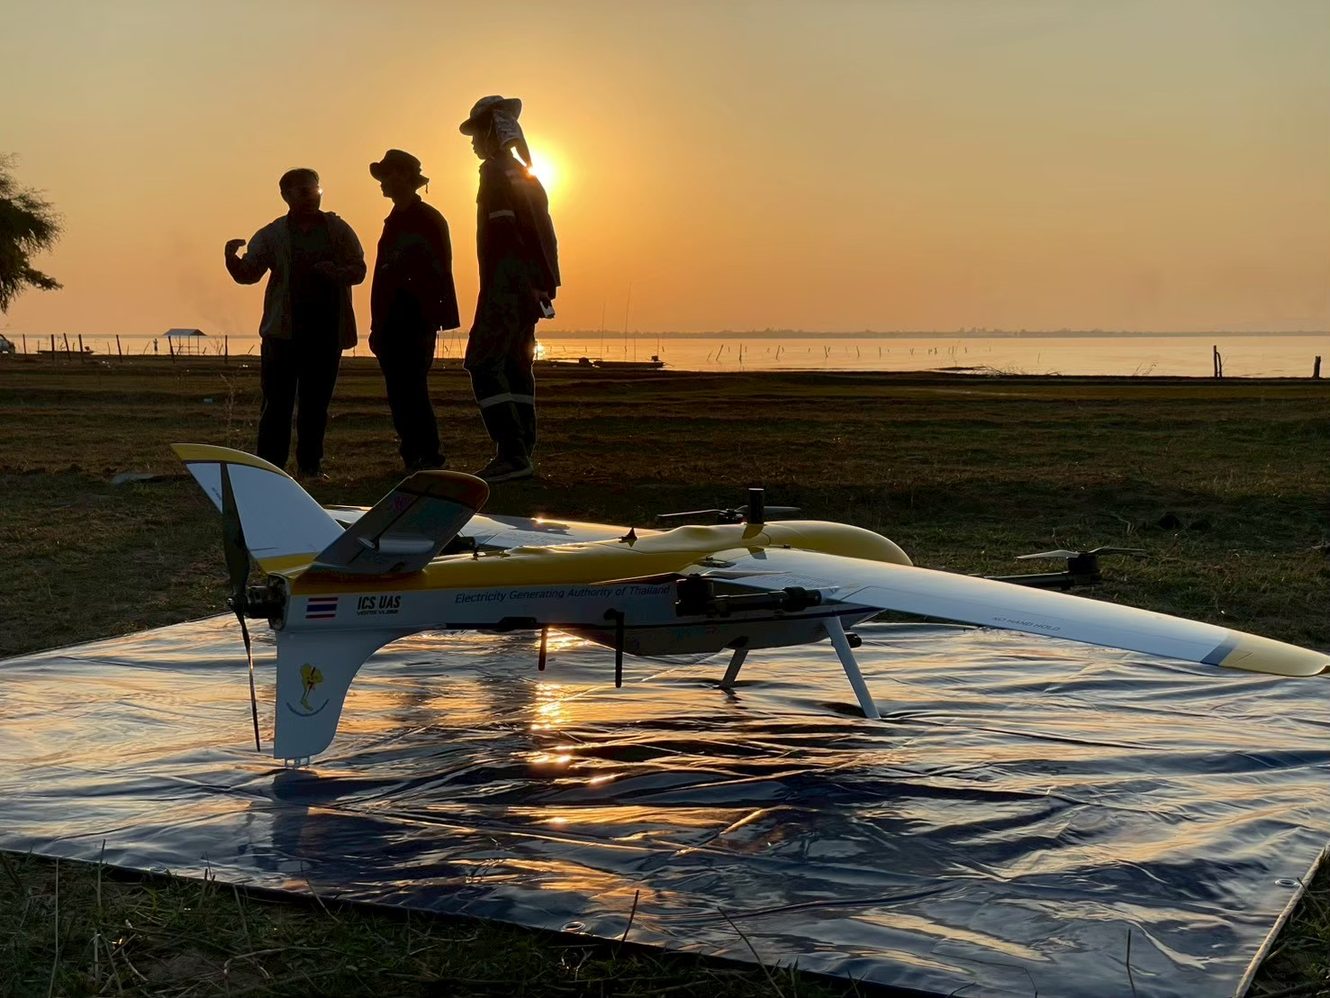
  • Ubolratana Dam survey

    On-site training, live job · Khon Kaen

    Ubolratana Dam survey

    On-site training on a live dam survey

    EGAT
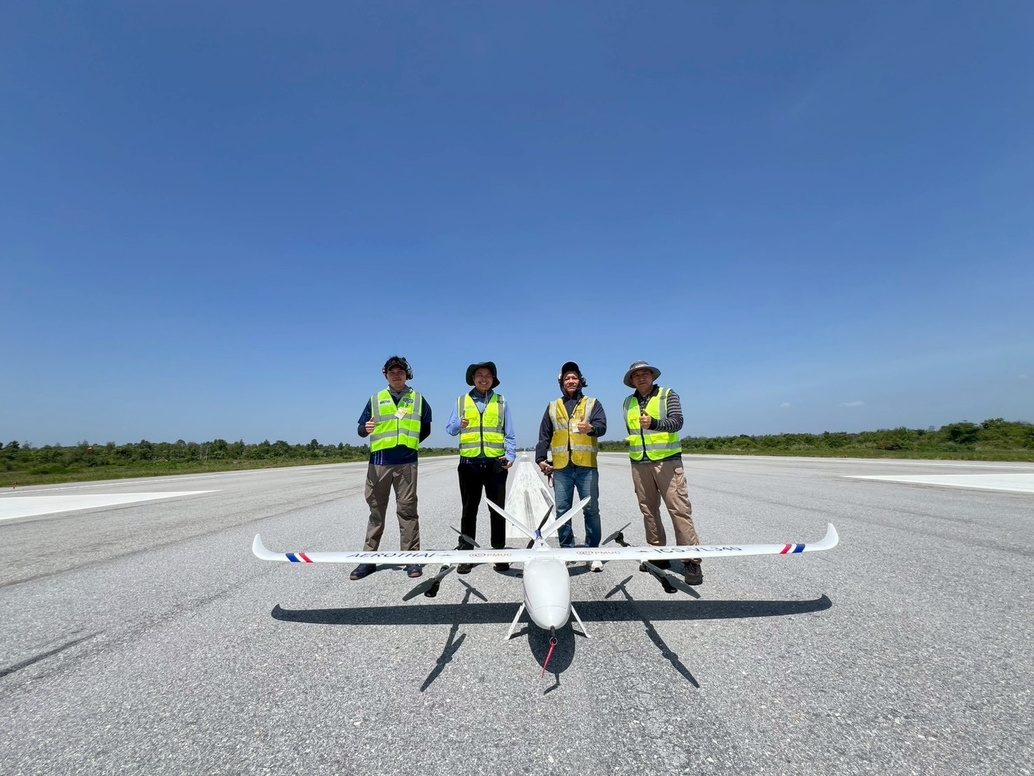
  • PAPI light check flights

    On-site training, live job

    PAPI light check flights

    Flight checks of an airfield's precision approach path indicator (PAPI)

    AEROTHAI
  • Survey flights in Phayao

    On-site training, live job · Phayao

    Survey flights in Phayao

    On-site training on a live survey

    BAR9 SE

How one flight runs

Vertical take-off from a small pad, fixed-wing flight along the survey lines, then a circling descent and vertical landing. Every step runs automatically from the flight plan.

  1. 01

    Flight planning

    Area and survey lines set in FlightLync

  2. 02

    Pre-flight and take-off

    Automatic checks, then a vertical take-off from a small pad

  3. 03

    Climb to altitude

    Vertical climb to a safe height

  4. 04

    Fixed-wing transition

    Speeds up and flies on the wing to save energy

  5. 05

    Route execution

    Captures along the lines at the set overlap

  6. 06

    Circling descent

    Circles down over the landing point

  7. 07

    VTOL transition and landing

    Slows and lands vertically where it started

  8. 08

    Data download

    Data goes straight on to processing

Hilly ground, full overlap, no gaps

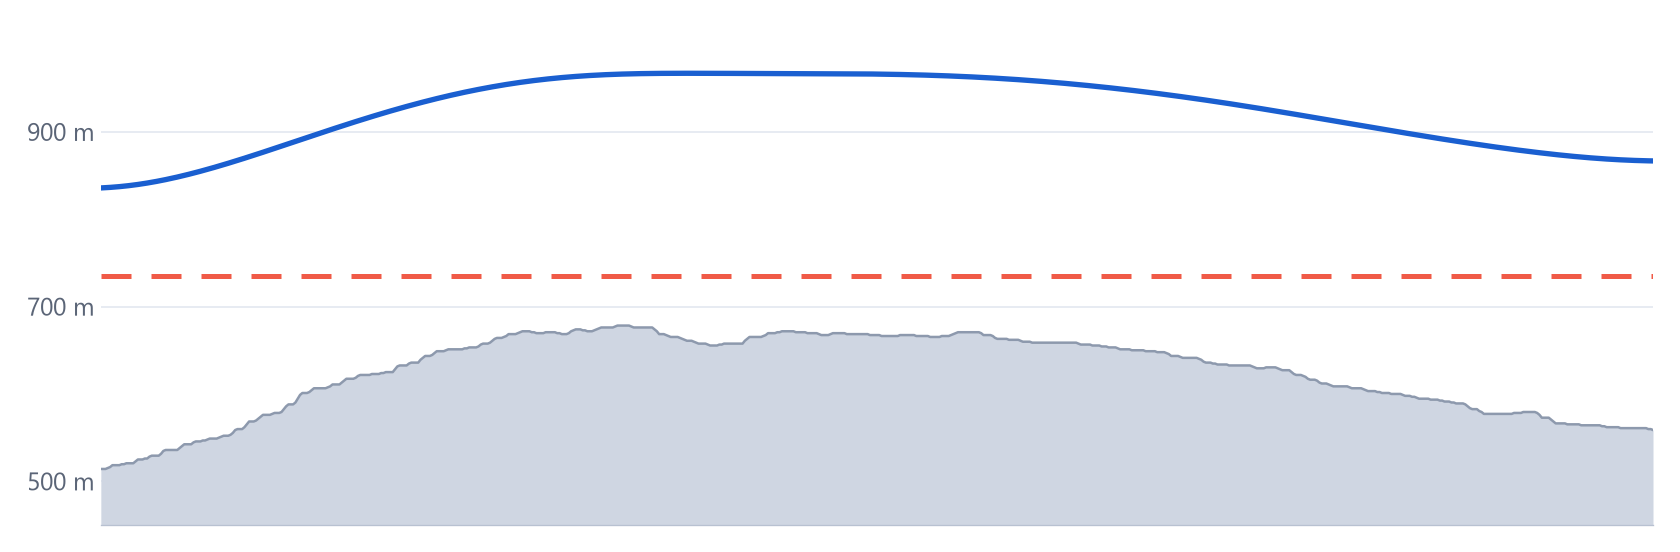
A map is built from overlapping photos: every point on the ground has to appear in several of them. Fly one fixed altitude over hills and the hilltops rise toward the camera, each photo covers less ground, the overlap runs out and the map gets holes. Terrain following holds the same height above the ground on every line, so overlap stays constant and every point is mapped.

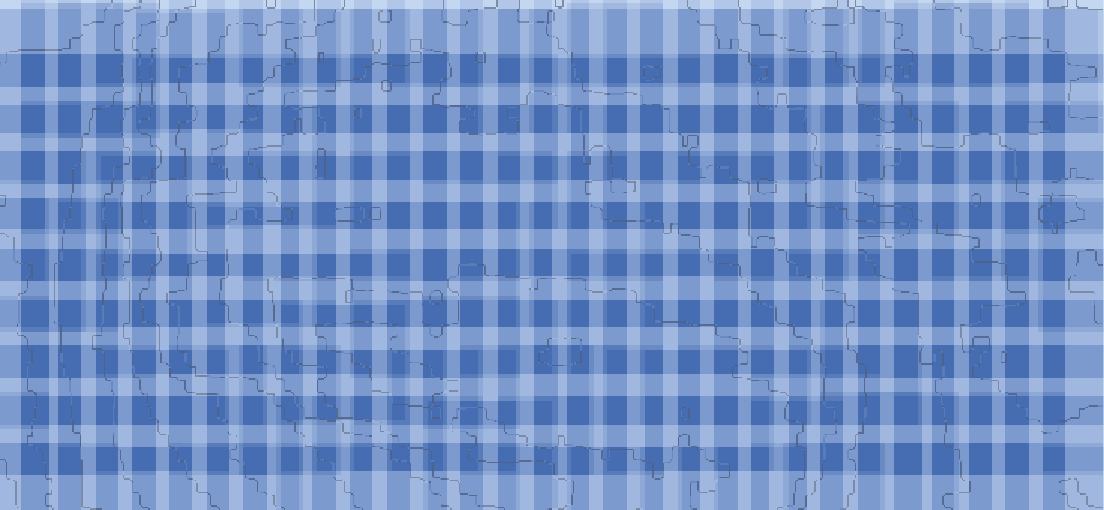
Coverage at constant altitude, with red gaps over the hill
One fixed altitudeOverlap runs out: 19% of the map missing on the hilltop
Coverage with terrain following, no gaps
Terrain followingEven overlap: 100% of the map covered

No overlap = gap in the mapDarker = more overlap (the point is in more photos)

One line in section: ground, constant-altitude path, and terrain-following path 300 m above ground
Constant altitudeTerrain following (300 m above ground)Ground

Simulated flight plan over real terrain data, not a flight result: RGB camera, 50 mm lens, 60/60% overlap at 300 m, 12 lines 105 m apart.

What you deliver

Outputs from the mapping cameras and LiDAR that ICS fits and calibrates.

  • Orthomosaic (GeoTIFF)
  • DSM / DTM
  • Contour lines (DWG)
  • AI object classification
  • 3D mesh (OBJ)
  • Point cloud (LAS/LAZ)
  • Volume report
  • Elevation profile
  • RGB mapping camera
  • Oblique camera
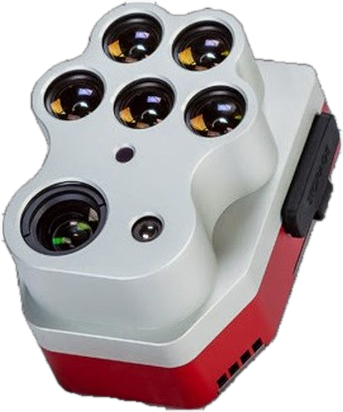
  • Multispectral camera
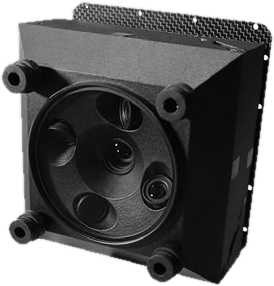
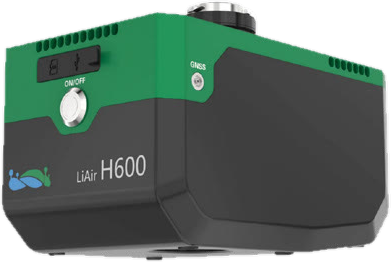
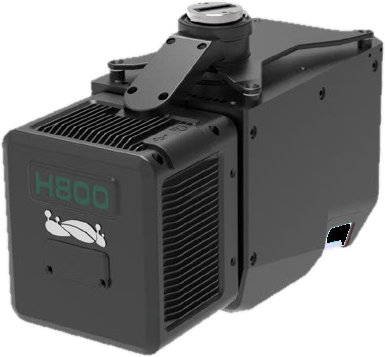
  • Medium-range LiDAR
  • Long-range LiDAR

FlightLync (Ground Control Software)

Plan, pre-check and monitor every flight in one program

Windows ground control station for automated flight planning and control, with pre-flight checklists and performance-limit alerts, survey and corridor missions, and real-time monitoring with live video.

  • Survey and corridor planning with auto overlap
  • Import your own Ortho and DEM, works offline
  • GIS tools: measure distance and area, draw polygons
  • Terrain following for even overlap over hills
  • ADS-B and no-fly-zone import
  • Pre-flight check: sensors, motors, servos, battery
  • Live telemetry and video, geotagged log
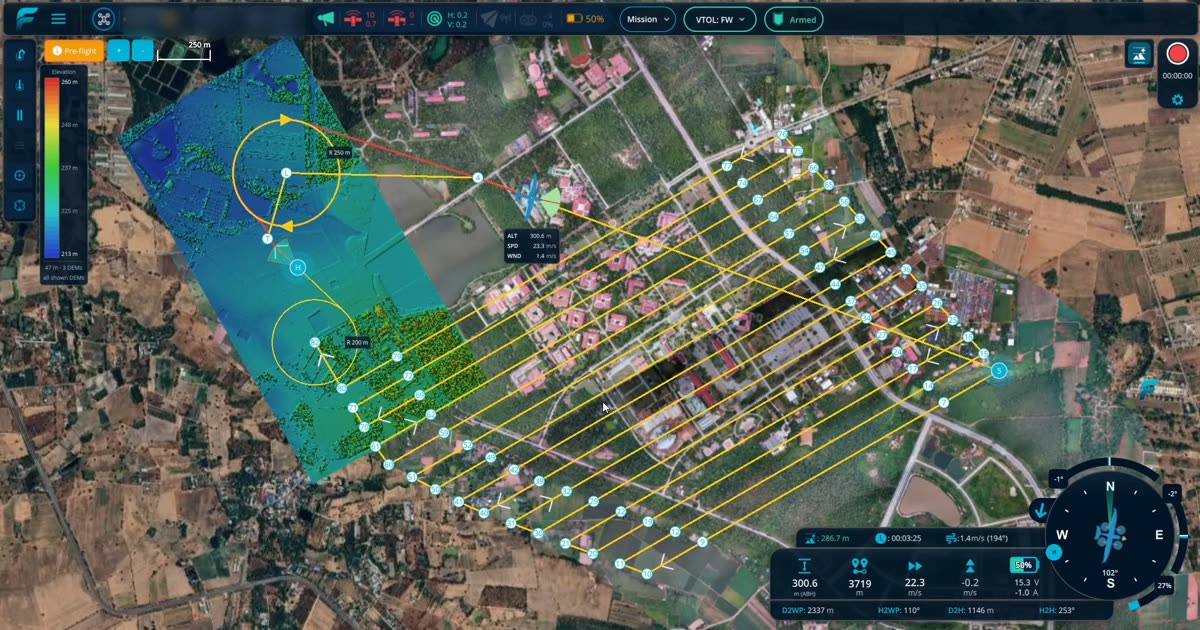
FlightLync: Survey flight lines with automatic overlap

Request a flight demo

Enter your mission and area to see the right aircraft and a rough time estimate, then send it to our engineers to prepare an on-site demo.